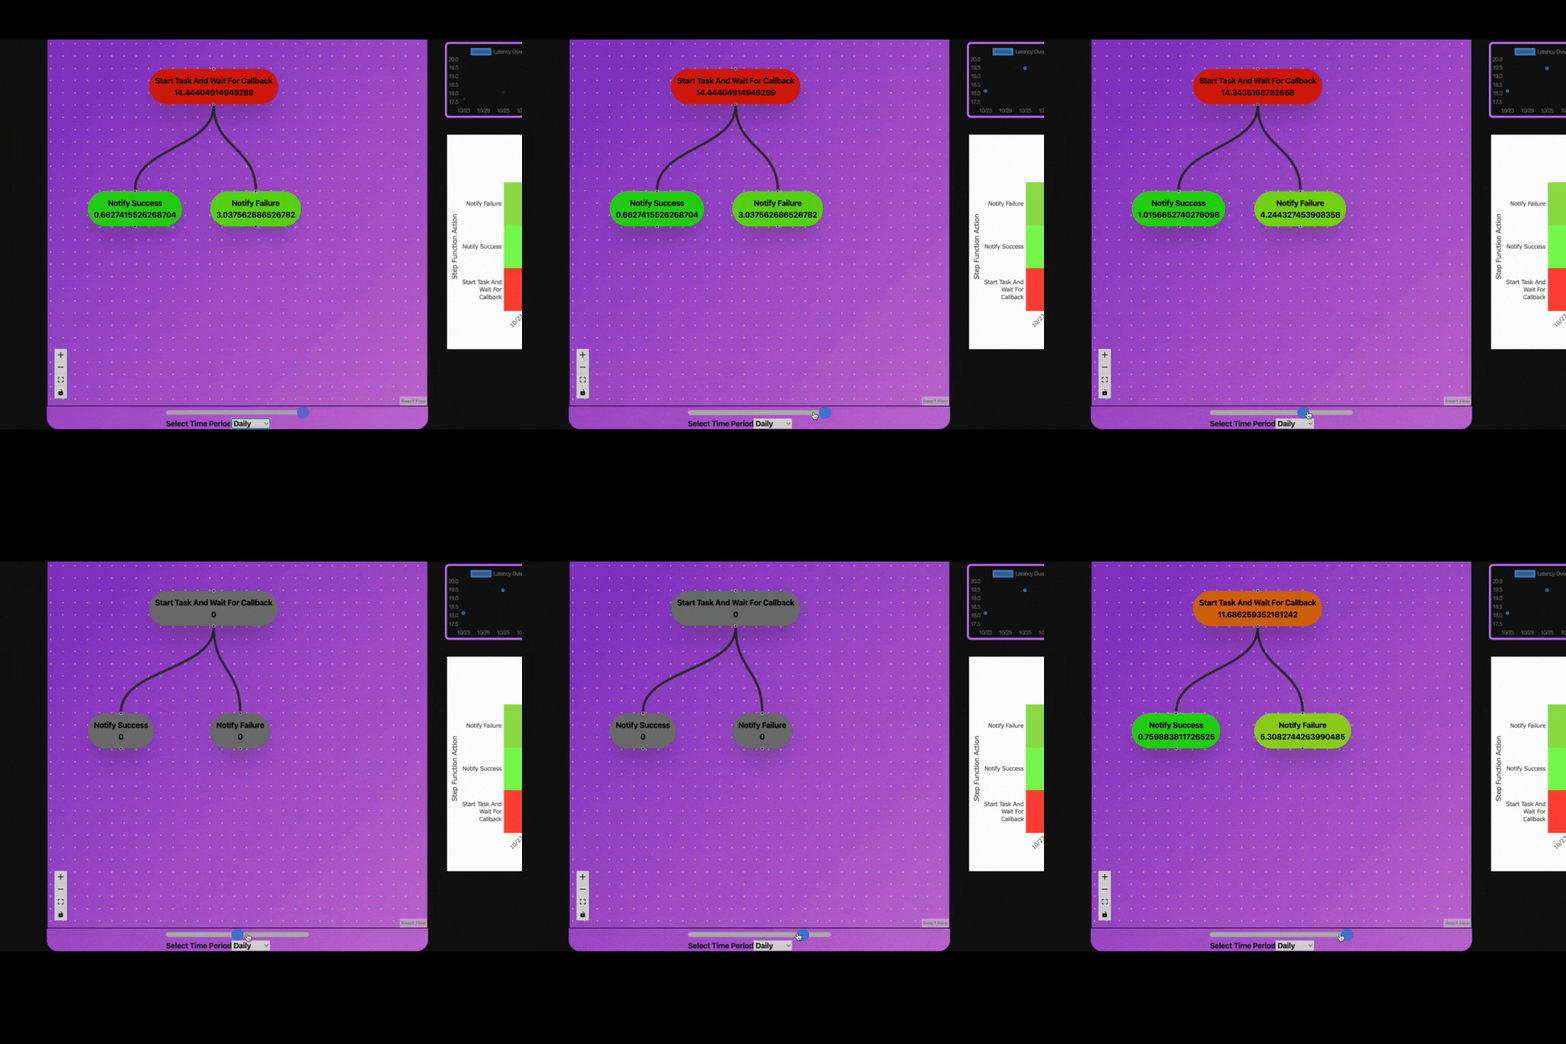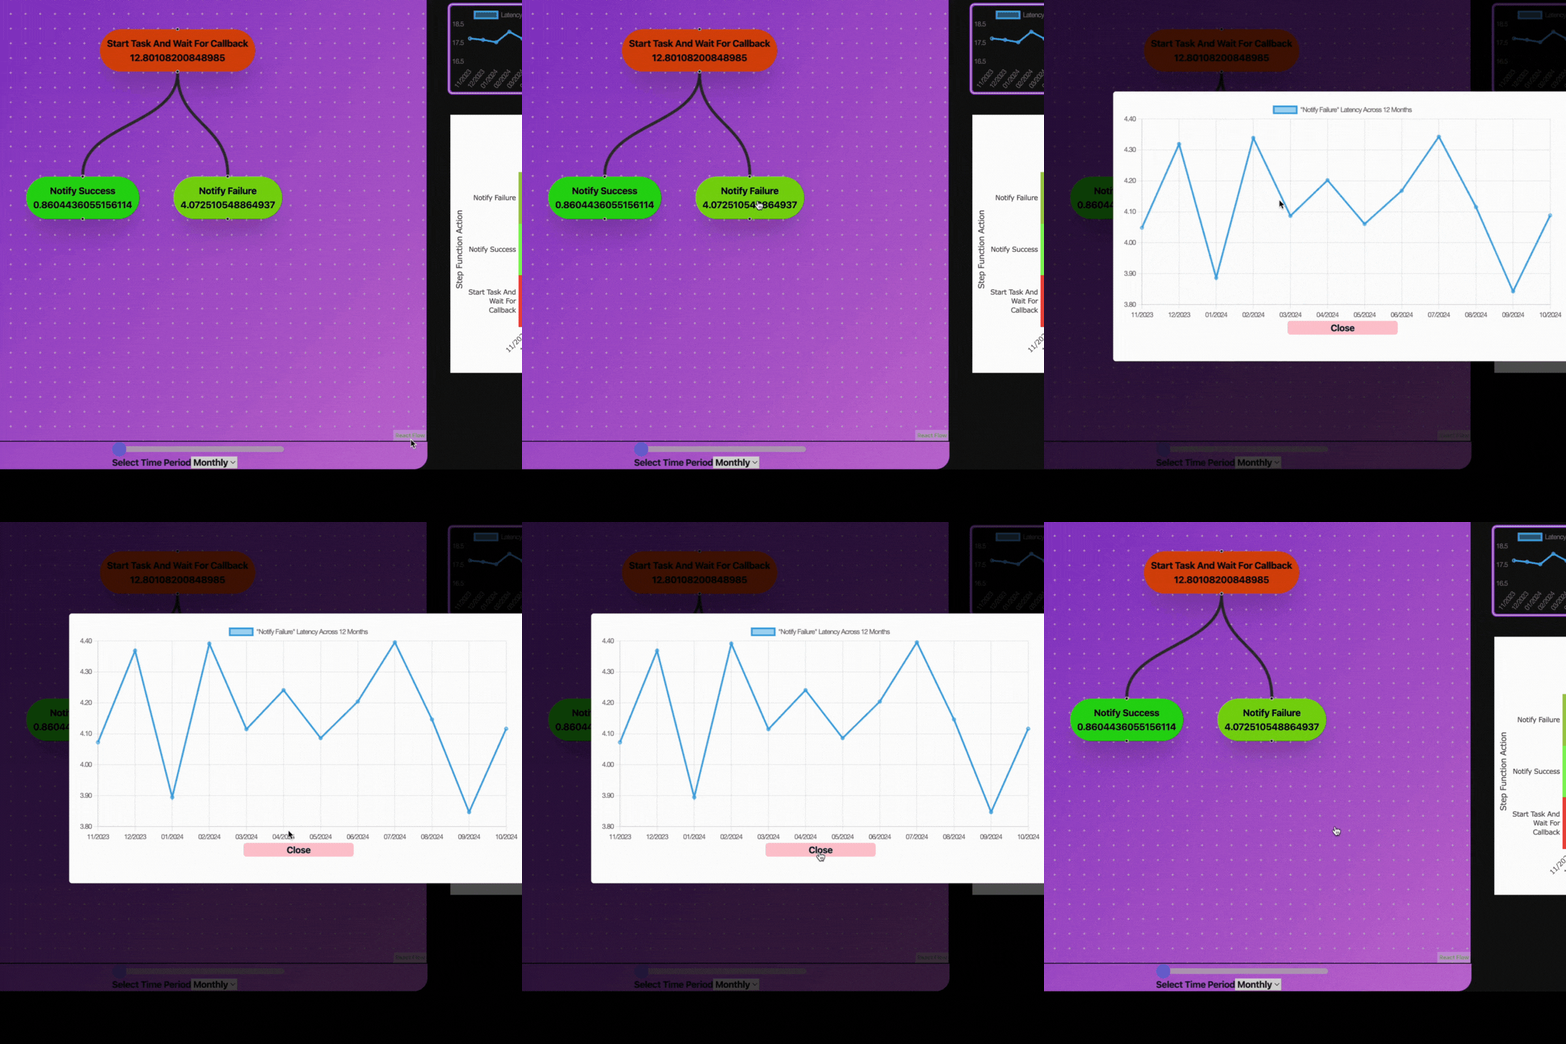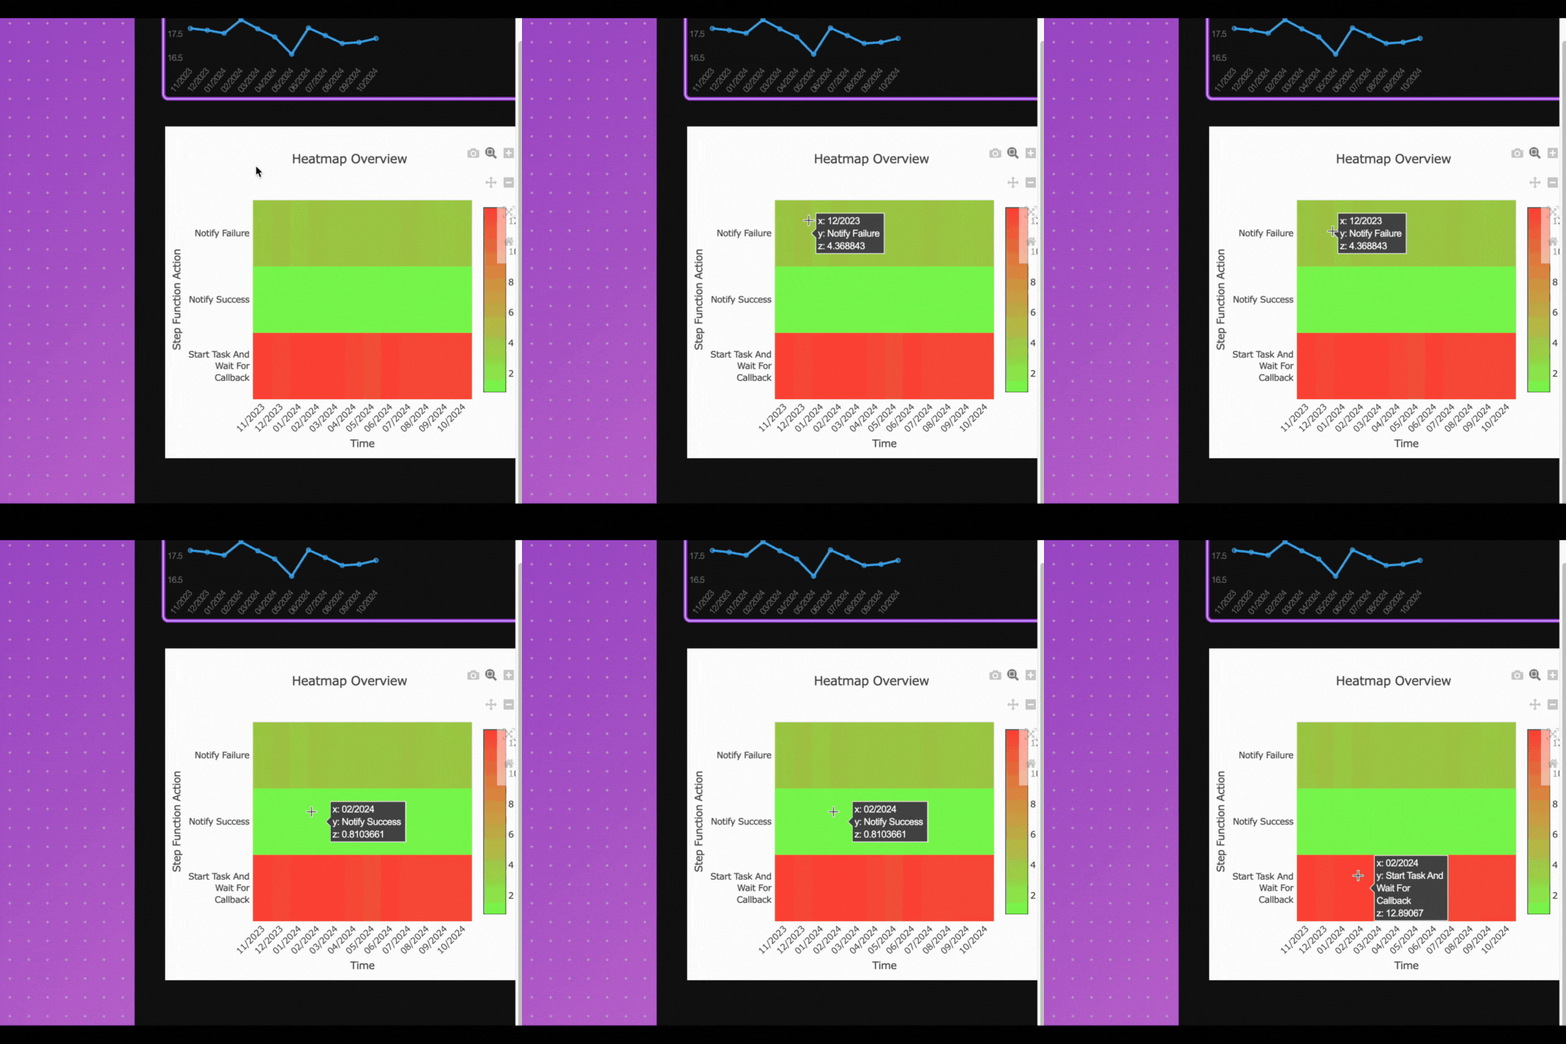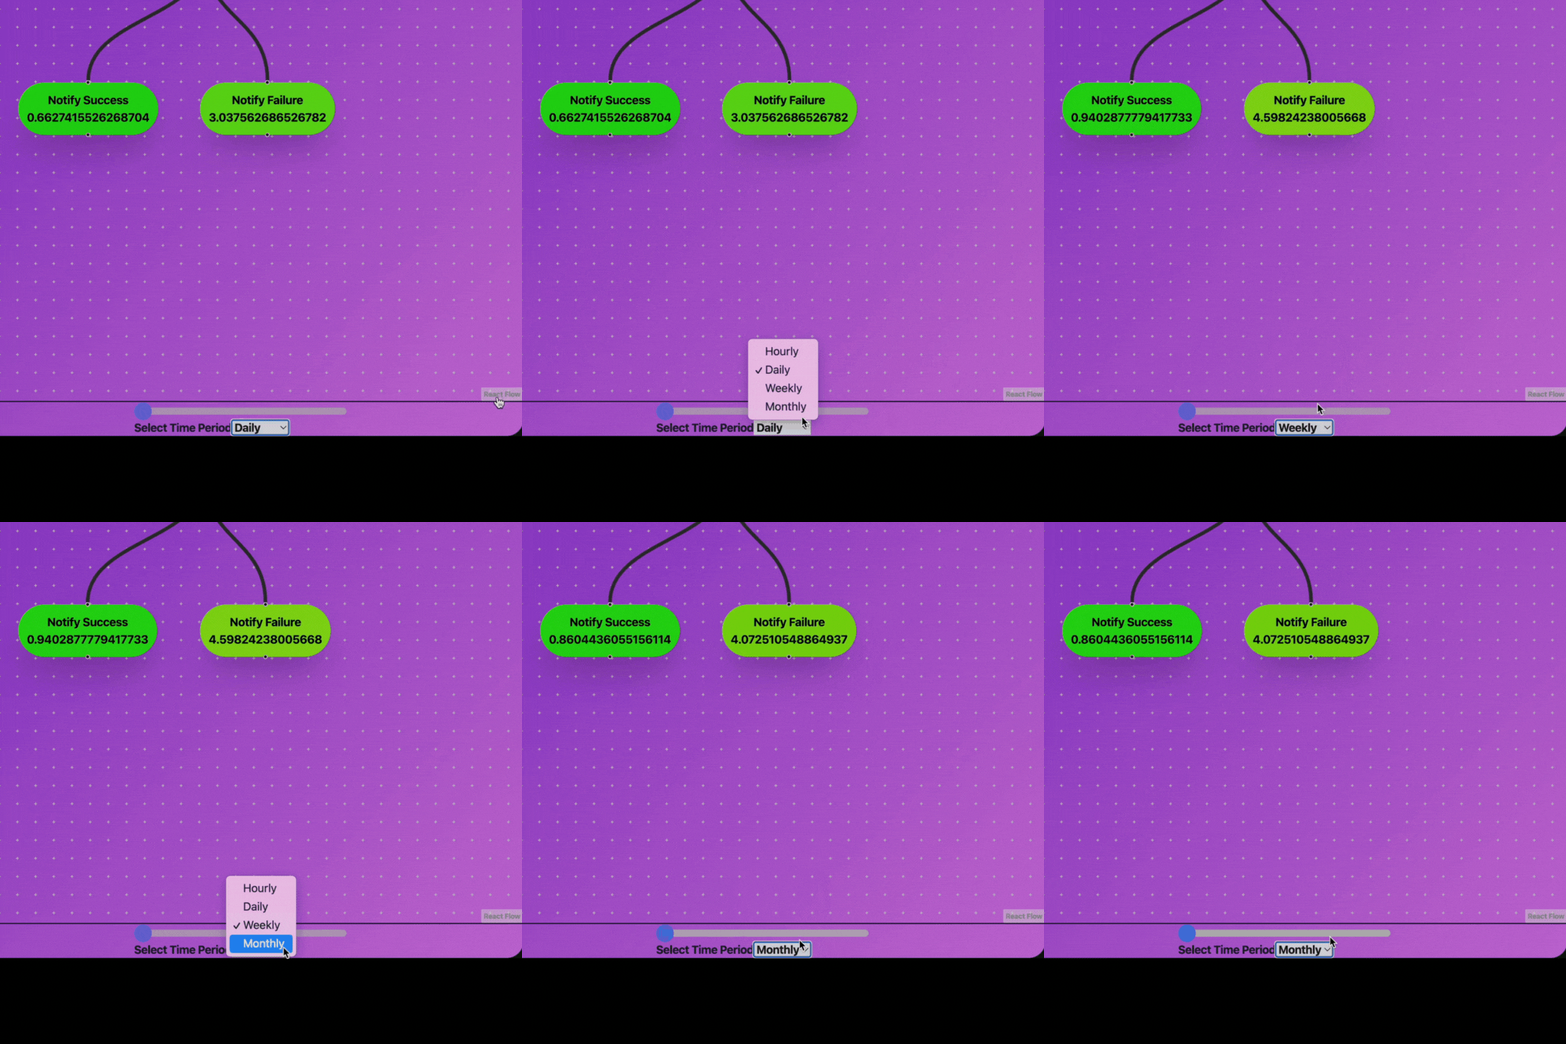


TimeClimb helps visualize AWS Step Function latency averages over custom time ranges (day, week, month, or year), displaying overall step function and individual step latencies. Users can view line charts for time-based latency trends and click on individual steps to see detailed latency metrics on a line chart. A heat map displaying each step's latencies over the selected period of time will display by default.


Alex Stewart
alexjstewart220@gmail.com

Andrew Mott
andrew@andrewmott.com

Austin Cheng
austincheng25@gmail.com

Paul Uhlenkott
pauluhlenkott@gmail.com

Sharon Patterson
sharonpatterson808@gmail.com